Introduction
Funnel and pyramid charts offer distinct advantages for visualizing processes and hierarchies. Funnel charts track progress through stages, highlighting potential bottlenecks. On one hand the pyramid chart showcases hierarchical relationships, emphasizing broader categories and their specific components. Well, on the other hand, funnel charts are limited in their ability to depict complex hierarchies. Let's explore more about the funnel & pyramid chart so that you can make your data presentations clear and impactful.
Understanding Funnel Charts
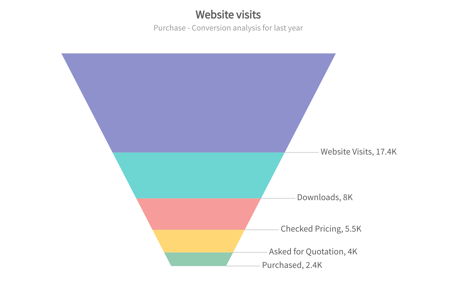
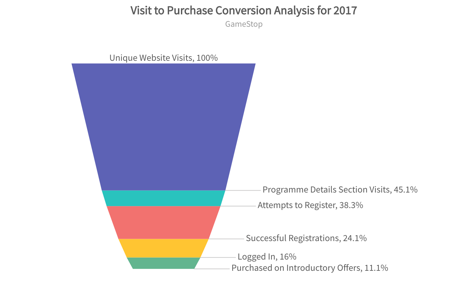
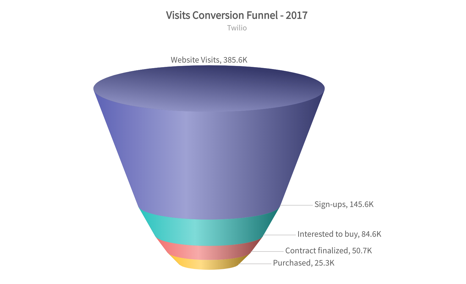
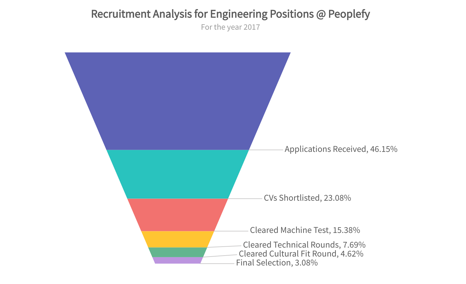
Funnel charts are a type of chart, often used to represent stages in a sales process and show the amount of potential revenue for each stage. This type of chart can also be useful in identifying potential problem areas in an organization’s sales processes. A funnel chart is similar to a stacked percent bar chart.
Understanding Pyramid Charts
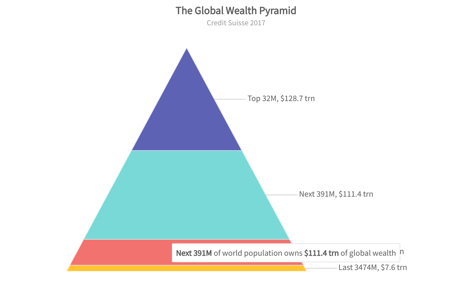
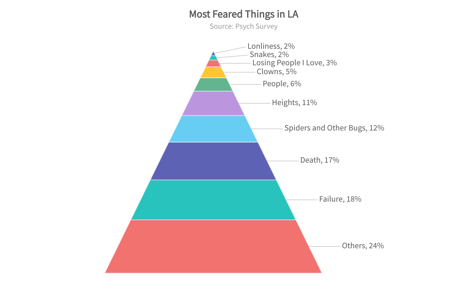
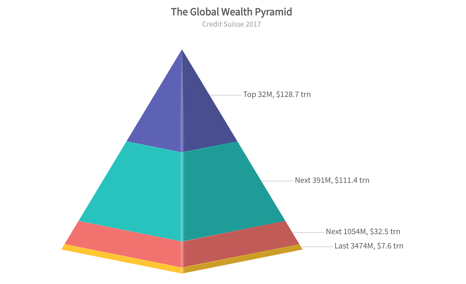
A pyramid chart has the form of a triangle with lines dividing it into sections. A related topic or idea is placed in each section. Because of the triangular shape, each section is a different width from the others; this width indicates a level of hierarchy among the topics. For example, the widest section may contain a general topic and the narrowest section may contain a much more specific topic from within that general topic. However, the width is not visually representative of the quantity beyond larger or smaller. Pyramid chart maker are put to the best use when items need to be arranged in a way that shows hierarchical structure, as well as quantity or size.
What is the Difference Between Funnel & Pyramid Chart?
Funnel and pyramid charts offer distinct advantages for visualizing processes and hierarchies. Let’s have a glance at some of the major differences between funnel and pyramid chart:
- Funnel Charts depict a sequential flow of data, where the value typically decreases as you move down the stages. On the other hand, by using pyramid chart maker you can create pyramid charts that do not necessarily imply a sequential flow. The data can be organized based on size or importance, with broader categories at the base and more specific components stacked on top.
- Funnel Charts focus mainly on reducing value as data progresses through the stages. Pyramid charts focus on portraying the composition of a whole.
- Funnel charts emphasize the proportion of data at each stage, while pyramid charts focus on the relative size of each category as a whole.
Unlock the Power of Funnel & Pyramid Charts with FusionCharts!
Are you ready to enhance your data visualization skills with funnel and pyramid chart maker? Start creating interactive Funnel & Pyramid charts with FusionCharts today and gain deeper insights into your data. Get started now!