Analyze Market Trends With Candlestick Charts
Harness the power of candlestick charts to analyze and interpret market trends.
What is a Candlestick Chart?
The experienced traders of today understand that emotions and sentiments influence stock prices. A candlestick chart carefully analyzes these emotions and builds a picture that can be easily understood. Patterns that are formed with the help of these charts help identify trend reversals that often give a trader an effective and reliable signal.Candlestick Chart Example
Below is the example for Amazon stock price.Candlestick Chart Patterns
A live candlestick chart reveals various patterns that can provide plenty of investment opportunities for businesses. Let’s take a look at some of the most prominent patterns one by one:Hammer Candlestick
Hammer patterns reveal the selling pressure that takes place throughout the day. Green hammers showcase a more robust bull market than the red ones. It is shaped like a short body and has a long lower wick.Shooting Star Candlestick
Resembling the shape of an inverted hammer, the shooting star patterns take an uptrend with a small lower body and a long upper wick. It indicates a market with a gap that is slightly higher on opening, hitting an intra-day peak and then closing above the opening price.Doji Candlestick
The shape of the Doji live candlestick chart looks closely like a cross or plus sign. A pattern like this is formed when the market’s open and close are at the same price points. This clearly points out the struggle between the sellers and buyers, resulting in no net gain for either party.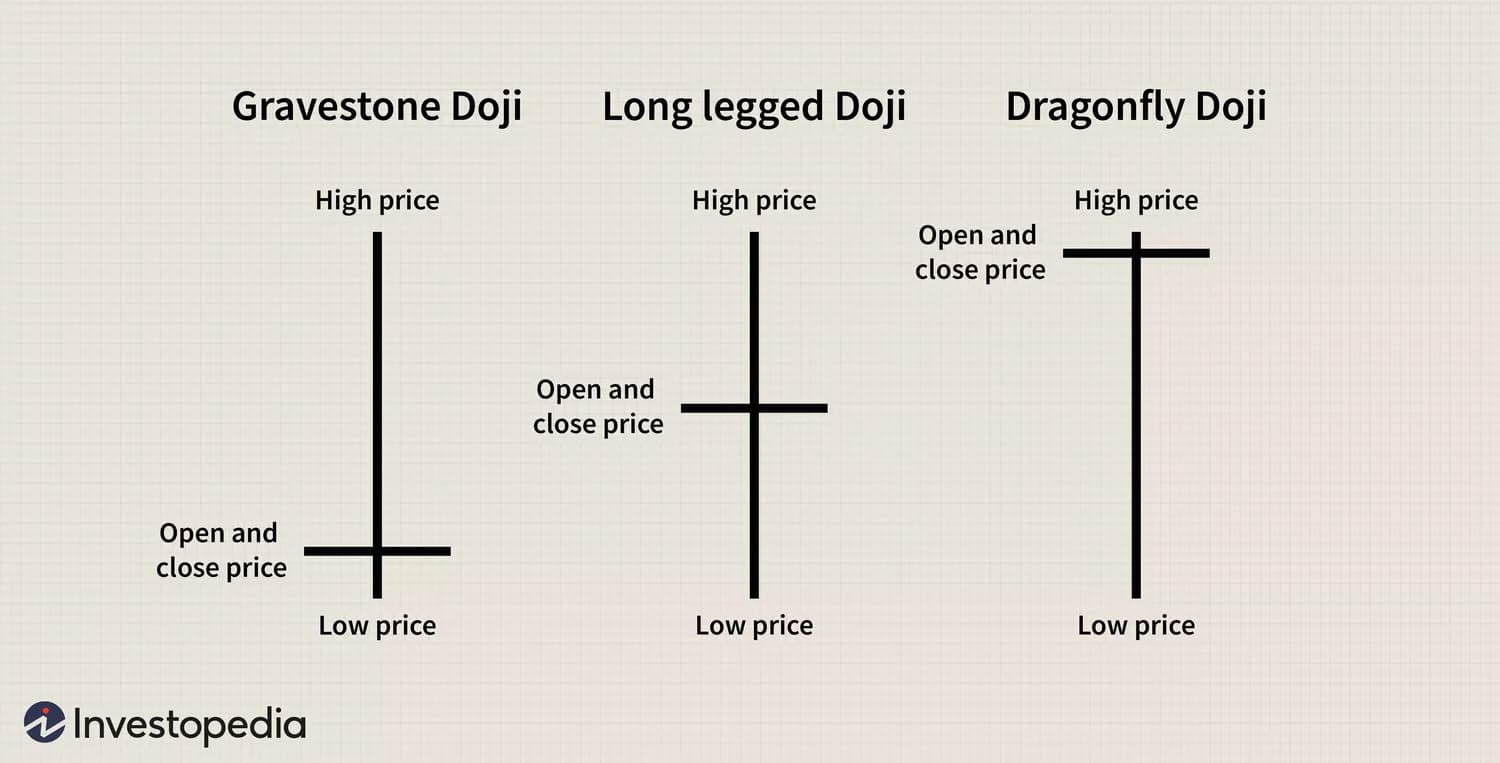
Bullish Engulfing Candlestick
Formed using two candlesticks, the short body in the bullish pattern is engulfed with a large body. Although the market on the second day opens lower than the first one, the market pushes the price up and creates a win for the buyers.
Bearish Engulfing Candlestick
During the slowdown, price movement occurs, and the peak is identified with a bearish candlestick chart live pattern. It is usually represented with a first small green candle engulfed by a longer red candle.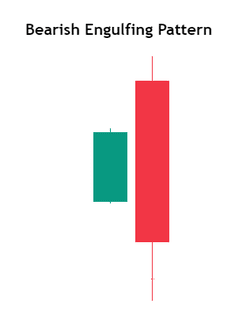
How to Read Candlestick Charts
Step 1: Open a Candlestick chart
You can begin by accessing a financial charting platform or website that provides candlestick charts for your analyzing asset.Step 2: Understand Timeframes
After the first step, you'll need to determine the candlestick charts free timeframe. For example, 1 minute, 1 hour, and 1 day to grasp the duration of each candlestick representation.Step 3: Decode Candlestick Language
You need to understand the core elements like bodies for opening and closing prices and wicks for highs and lows- interpreting the language of market movements.Step 4: Spot Trends with Color Clarity
In this step, quickly identify trends with color cues: green/white for bullish, red/black for bearish, providing a visual guide to market direction.Step 5: Master Patterns for Actionable Insights
Now, boost your trading game by recognizing common patterns (doji, hammer, shooting star) and gaining valuable insights for strategic decision-making.
Bonus: How To Read Candlestick Charts?
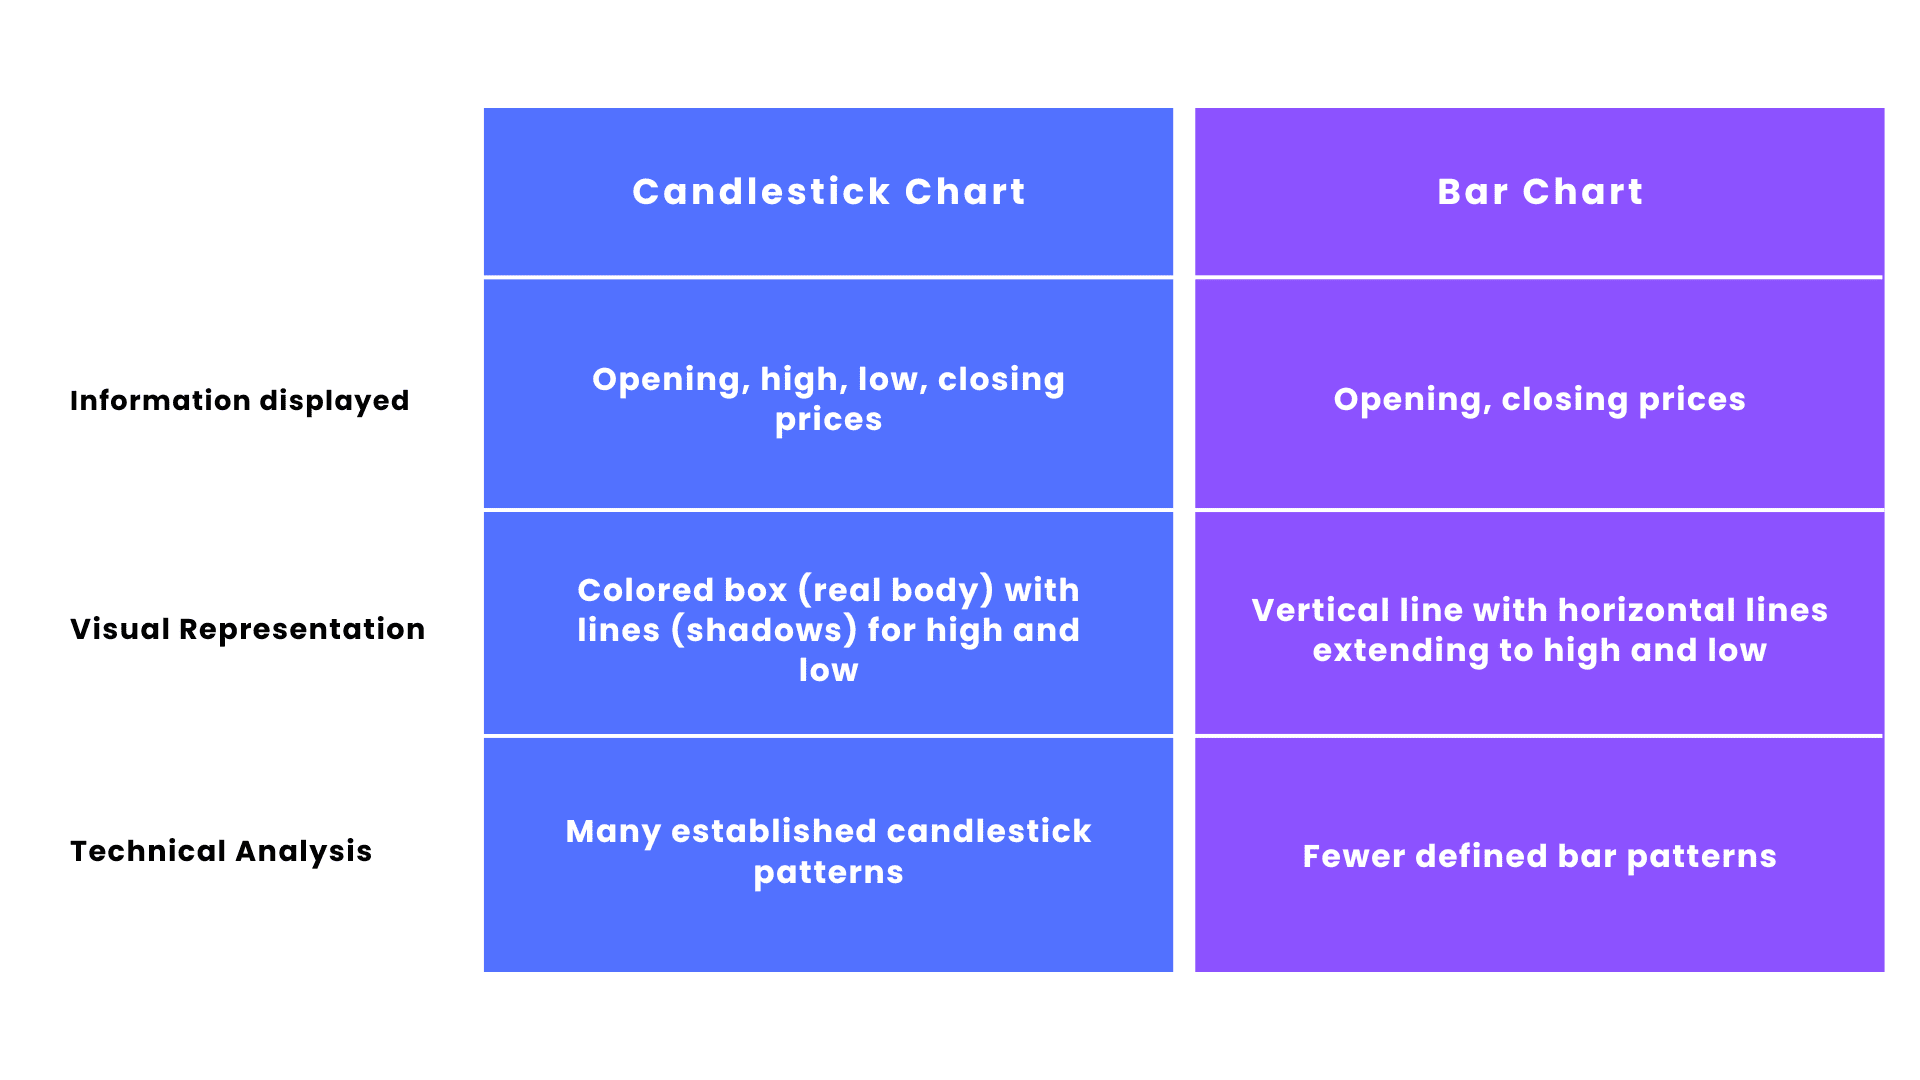
Candlestick vs. Bar Charts