Vue Component for FusionCharts
Interactive examples and Code Snippets
Features of the integration
Single component for everything
Add charts and maps using single Vue.js component
Support for data binding
Keep all your chart elements in sync with native support for Data Binding.
Multiple data types
Insert charts from a JSON URL, an XML URL, or using Props Array Binding.
Add interactivity with ease
Enable interactivity between charts with hundreds of events and methods
Complete control over configurations
Enjoy advanced control with full access to FusionCharts object that contains complete chart configurations.
Build 100+ charts and 2000+ maps
Go beyond column charts and pie charts with our 100+ charts made for any kind of data. From area to donut and marimekko to radar, we’ve got all your charting needs covered. Don’t just stop at charts, with 2000+ maps, gauges and more, your dashboards and reports will become more meaningful and insightful.

Chart Gallery
Explore 100+ charts for your React application

Time Series Gallery
Explore how to plot millions of data on a time-series chart in React

Maps Gallery
Render 2000+ Maps for your React project


Dashboards built using Vue
We have built over 20+ dashboards for various industries and use-cases. The best part of these dashboards? They are open source and completely free to use! Just download them and explore how you can use Vue Charts for FusionCharts in the real-world.
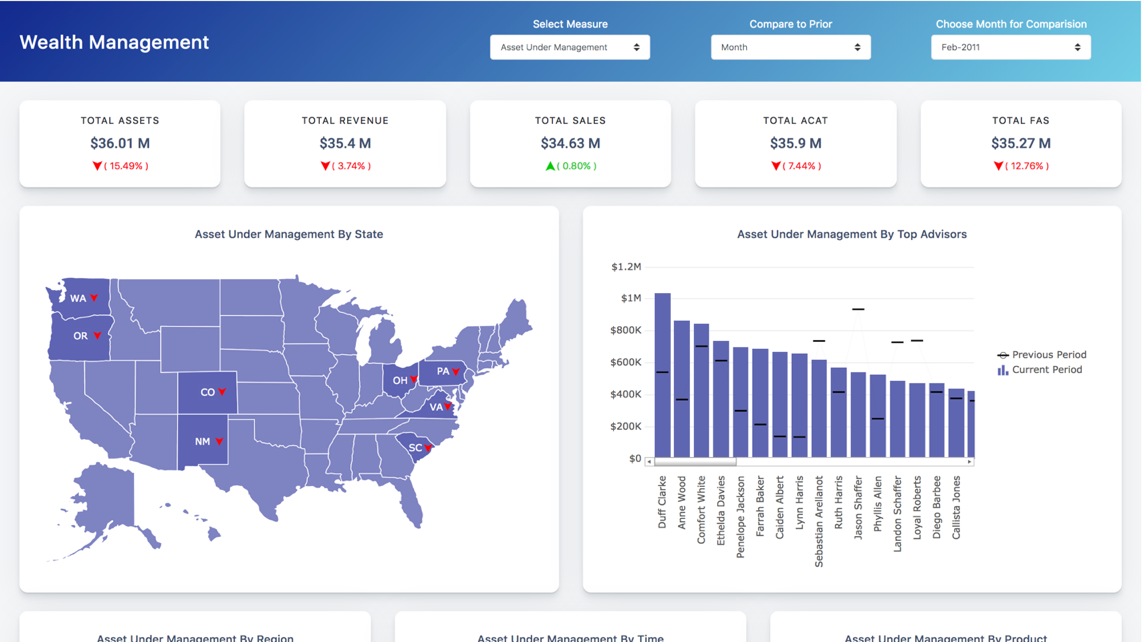
Wealth Management Dashboard
Manage wealth better by tracking the performance of financial assets. Our wealth management dashboard helps you track the distribution of assets by state, region, top advisors, time and product.
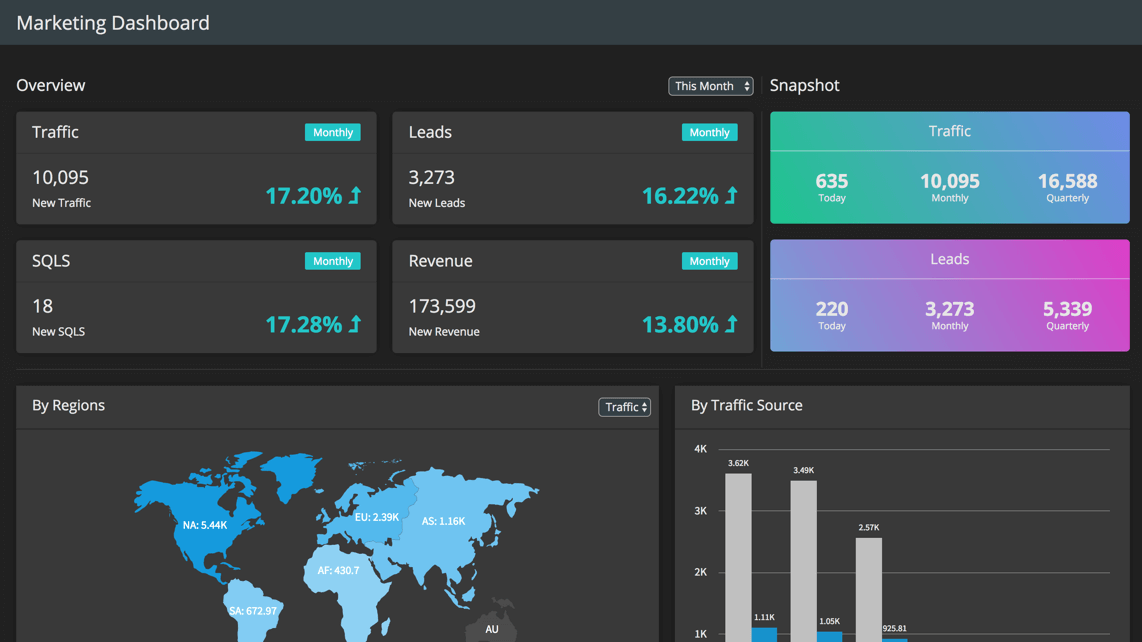
Marketing Dashboard
See the outcome of your marketing efforts with our Marketing Dashboard. Monitor the progress made towards each goal.
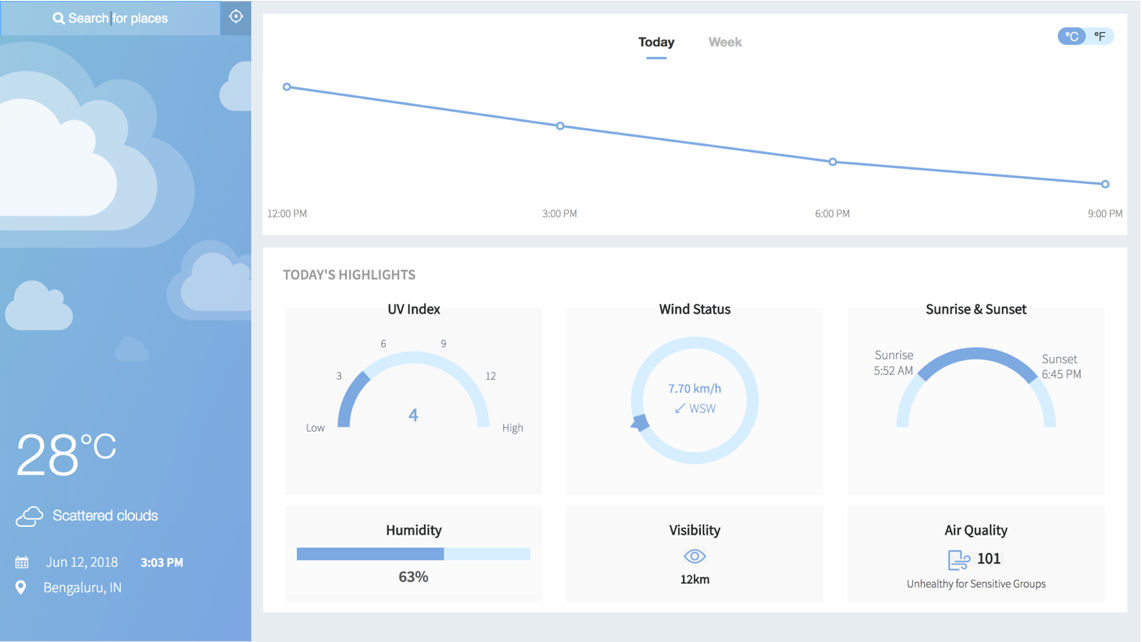
Smart Weather Dashboard
Monitor weather patterns to plan your day, streamline outstation visits, and anticipate inclement climate - or embed the dashboard in larger apps to keep users informed.


